More example images can be found in the galleries of the Official MolScript Web Site.
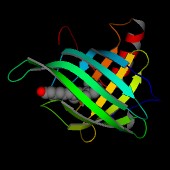 This image shows the secondary structure coloured in a rainbow ramp
from blue at the N-terminus to red at the C-terminus. The retinol
molecule is shown in a CPK representation.
This image shows the secondary structure coloured in a rainbow ramp
from blue at the N-terminus to red at the C-terminus. The retinol
molecule is shown in a CPK representation.
% molscript -jpeg 90 -accum 4 -size 170 170 -out rbp-std.jpg < rbp-std.in
!----------------------------------------------------------------
! MolScript v2.0 input file rbp-std.in
!
! Initial file produced by MolAuto v1.0, then modified by hand.
!
! RBP, standard view.
!
! Per Kraulis
!  22-Oct-1997

title "Retinol-binding protein"

plot

  slab 50;

  read mol "pdb1rbp.ent";

  transform atom * by centre position atom *
                   by rotation
                     -0.593897 0.165647 -0.787304
                      0.371135 0.924642 -0.0854205
                      0.713824 -0.342927 -0.610619
                   by translation 4 0 0
                   by rotation x -6
                   ;

  set segments 6;

  set planecolour hsb 0.6667 1 1;
  coil from 1 to 7;
  helix from 7 to 9;
  coil from 9 to 22;
  set planecolour hsb 0.5333 1 1;
  strand from 22 to 30;
  coil from 30 to 39;
  set planecolour hsb 0.4667 1 1;
  strand from 39 to 47;
  coil from 47 to 53;
  set planecolour hsb 0.4 1 1;
  strand from 53 to 62;
  coil from 62 to 68;
  set planecolour hsb 0.3333 1 1;
  strand from 68 to 79;
  coil from 79 to 85;
  set planecolour hsb 0.2667 1 1;
  strand from 85 to 92;
  coil from 92 to 100;
  set planecolour hsb 0.2 1 1;
  strand from 100 to 109;
  coil from 109 to 114;
  set planecolour hsb 0.1333 1 1;
  strand from 114 to 120;
  coil from 120 to 132;
  set planecolour hsb 0.06667 1 1;
  strand from 132 to 138;
  coil from 138 to 146;
  set planecolour hsb 0 1 1;
  helix from 146 to 158;
  coil from 158 to 175;

  set atomcolour atom C* grey 0.5;
  cpk in require residue 1 and type RTL;

end_plot
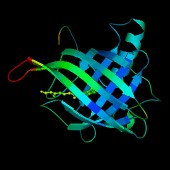 This image shows the secondary structure coloured according to the
B-factor values of the CA atom in each residue. The colours go from
blue (B-factor 8.0), through green to red (B-factor 45.0).
The retinol molecule is shown in a ball-and-stick representation with
the atoms also coloured according to their respective B-factors.
This image shows the secondary structure coloured according to the
B-factor values of the CA atom in each residue. The colours go from
blue (B-factor 8.0), through green to red (B-factor 45.0).
The retinol molecule is shown in a ball-and-stick representation with
the atoms also coloured according to their respective B-factors.
% molscript -jpeg 90 -accum 4 -size 170 170 -out rbp-bfactor.jpg < rbp-bfactor.in
!----------------------------------------------------------------
! MolScript v2.0 input file rbp-bfactor.in
!
! Initial file produced by MolAuto v1.0, then modified by hand.
!
! RBP, B-factor colours.
!
! Per Kraulis
!  22-Oct-1997

title "Retinol-binding protein"

plot

  slab 50;

  read mol "pdb1rbp.ent";

  transform atom * by centre position atom *
                   by rotation
                     -0.593897 0.165647 -0.787304
                      0.371135 0.924642 -0.0854205
                      0.713824 -0.342927 -0.610619
                   by translation 4 0 0
                   by rotation x -6
                   ;

  set segments 6;

  set hsbrampreverse on,
      residuecolour residue * b-factor 8 45 from blue to red,
      atomcolour atom * b-factor 8 45 from blue to red,
      colourparts on;

  coil from 1 to 7;
  helix from 7 to 9;
  coil from 9 to 22;
  strand from 22 to 30;
  coil from 30 to 39;
  strand from 39 to 47;
  coil from 47 to 53;
  strand from 53 to 62;
  coil from 62 to 68;
  strand from 68 to 79;
  coil from 79 to 85;
  strand from 85 to 92;
  coil from 92 to 100;
  strand from 100 to 109;
  coil from 109 to 114;
  strand from 114 to 120;
  coil from 120 to 132;
  strand from 132 to 138;
  coil from 138 to 146;
  helix from 146 to 158;
  coil from 158 to 175;

  ball-and-stick in require residue 1 and type RTL;

end_plot